Powering and Fuel Consumption Impact of EverClean Service on Two Vessels
May 14, 2024
White PaperContents
Introduction
Shipping accounts for 3% of greenhouse gas emissions. The International Maritime Organization has adopted measures that aim to reduce the carbon intensity of international shipping by 40% by 2030 (IMO 2022). One of the most critical factors in improving shipping efficiency is hull condition. Today ships are typically cleaned using reactive methods when a threshold level of fouling has been observed or powering performance has noticeably deteriorated. This means that vessels are typically operating at a significant penalty.
Hull condition deteriorates within minutes of a hull hitting the water as bacteria and other organic matter (on the scale of micrometers) settle. Biofilms and microfouling (on the scale of millimeters) develop over days to weeks, and macrofouling (with sizes of centimeters) develops in the next weeks to months. The IMO estimates that the earliest stages of biofilms alone on a ship’s hull can cause fuel penalties up to 20% (IMO 2022), and early stages of macrofouling can cause penalties of 40%.
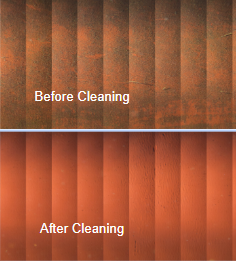
Greansea IQ’s EverClean program offers a robotic solution to prevent the deterioration of a vessel’s hull condition from deteriorating after undocking, proactively maintaining it fouling-free and operating without a fuel penalty. Proactive cleaning is the regular and thorough disruption of growth on a ship hull coating by gentle brushing with small soft-bristled brushes to maintain a ship as “always clean” (Kinnaman 2019). This paper describes the impact of the EverClean service on two cruise ships, the effects on the hull’s fouling condition, and the resulting reduction in powering penalties.
EverClean Service
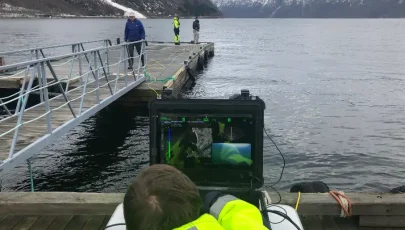
EverClean robots have been designed to remove fouling from hull coatings as efficiently as possible. EverClean robots have a 0.7m wide cleaning swath and typically use an overlap distance of 0.5m between cleaning passes, equating to 70% swath overlap. Robots crawl at speeds of 0.3-0.5 m/s, typically achieving a production rate of 540 m2 per hour. Cruise ships like the ones presented here, with a total wetted surface area of 8,000-10,000 m2, can be cleaned in roughly 15-18 hours, usually needing 3 port calls to complete a full round cleaning.
EverClean robots collect continuous video of the coating behind the robot during cleaning operations, as well as hull-relative positional data. Videos of the hull can be broken down into still frames, matched with the robot’s location, and then stitched together into georeferenced composite images. This approach provides a wide perspective of hull conditions and an understanding of the changes observed in the vessel’s powering performance.
The brushes used are engineered to work with fouling control coatings and the antifouling release strategies they employ, ensuring effective fouling removal without causing damage or hastening wear rates. Made of soft nylon, these brushes are designed for microfouling and the incipient stages of macrofouling species and generally will not remove macrofouling like barnacles when encountered. Brushes have been rated through testing for fouling up to level FR20.


Vessels
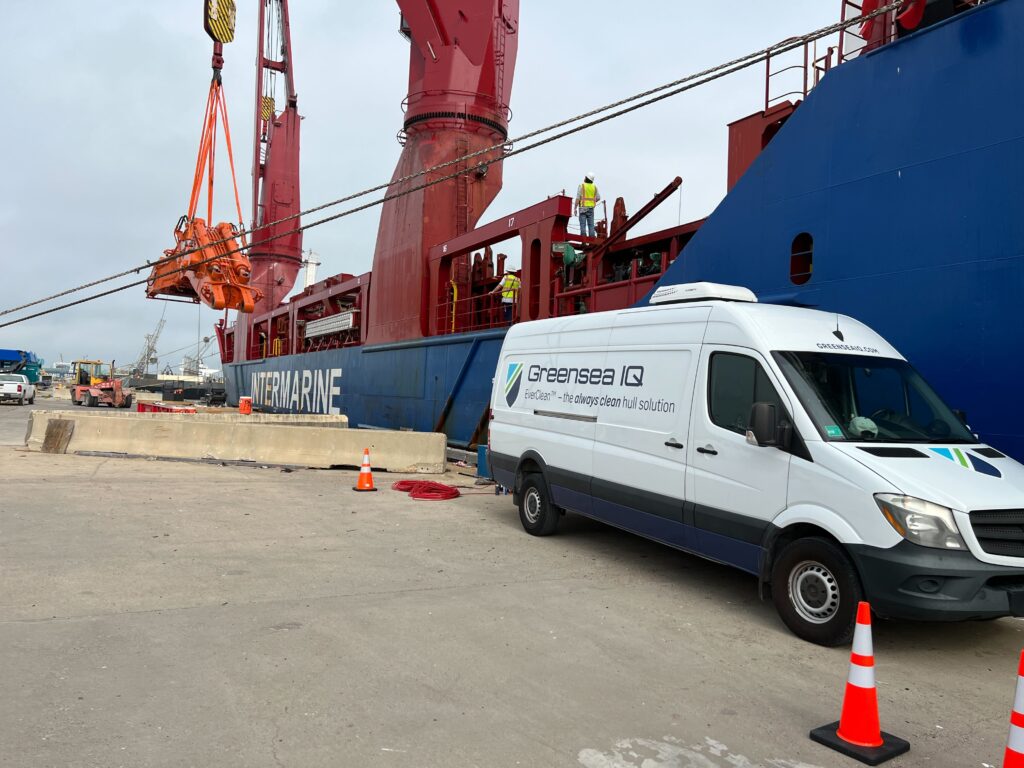
This paper presents data on two vessels serviced by Greensea IQ. Both vessels operated in the Gulf of Mexico and the Caribbean, which are considered to be places where fouling pressure is high. Vessel 1 was cleaned once over four calls to its home port of Galveston, TX. Vessel 2 was cleaned proactively for 7 months in 19 port calls, typically 2 to 3 per month, at its homeport of Miami, FL. Service of both vessels resulted in coverage by EverClean robots of roughly 90% of the wetted surface area per round of cleanings.
Vessel 1 is the larger of the two vessels, with a capacity for roughly 4000 passengers and 1500 crew. It operates at a cruising speed of 17 to 19 knots and power at propulsion of 11 to 14 megawatts. The vessel was coated with Hempel Globic SPC, which prior to service, was cleaned infrequently due to the logistical challenges faced by divers in the Port of Galveston, resulting in a coverage of macrofouling at the time of service.
Vessel 2 is smaller, with a capacity of 3000 passengers and 1100 crew. Vessel 2 operates at a cruising speed of 16-18 knots at 6 to 7 megawatts of power at propulsion. Vessel 2 employed a scheme of two coatings, Jotuns Seaquantum antifouling SPC on its vertical sides and International Intersleek 1100SR fouling release on its flat bottom. Vessel 2 had primarily microfouling at the start of service.
Fouling Assessment
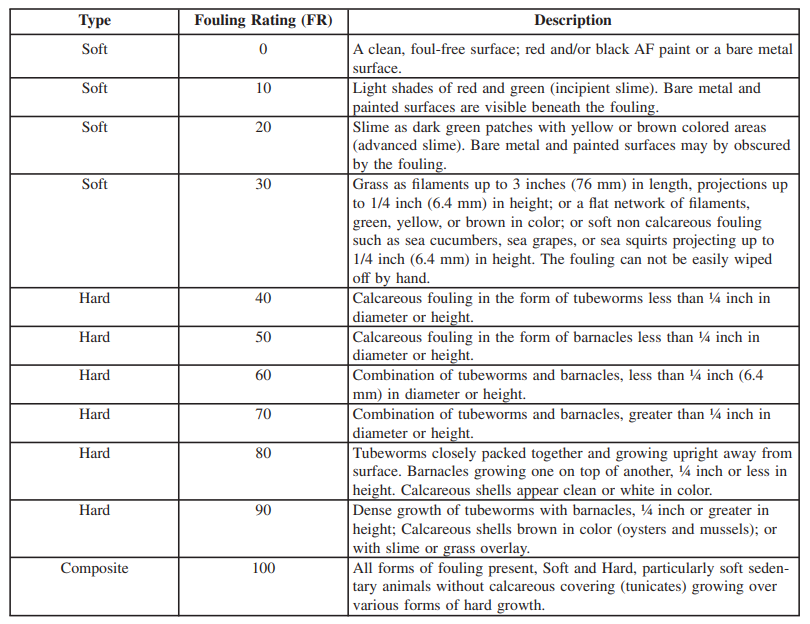
Assessors follow Naval Ships Technical Manual Chapter 081 to evaluate fouling coverage on vessels before and after service. The NSTM’s FR rating system provides 10 well-defined levels of increasing fouling severity on a scale of 0 – 100.
Varying ambient light and hydrodynamic conditions cause regions of the ship to foul differently, Evaluators break the vessel’s wetted surface areas into sections and assess fouling conditions separately in these regions to provide a comprehensive picture of fouling coverage on the vessel.
Powering Analysis
The ISO19030 standard is widely accepted by shipbuilders, ship owners, and coatings companies (Hempel 2018, Jotun 2017) for evaluating the impact of maintenance events like in-water cleanings on powering performance.
The primary parameters needed for the calculation are powering at propulsion and the vessel’s speed through water. Powering data collected immediately out of dry dock or in a 90-day ‘reference period’ before a maintenance event are used to develop a reference curve. Powering data collected during the ‘evaluation period’ is then compared point by point to the reference curve. A vessel’s powering performance indicator is calculated as the relative percentage of measured power to expected power.

Where:
- PD = powering performance indicator
- PM = measured power
- PE = expected power
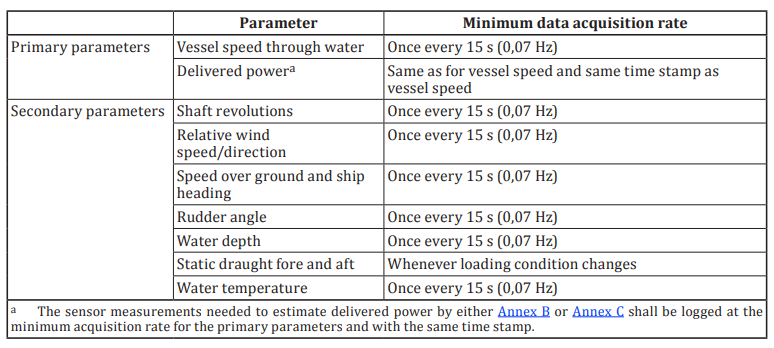
Secondary parameters ensure that data collected in the evaluation period can be accurately compared to that collected in the reference period. To be included, data must be collected at a constant draft and trim, in good weather, in deep water and when stabilizers are not in use.

Where:
- ΔP = PM-PE
- LCV = lower calorific value
Greensea IQ estimates fuel saved as a result of service using the difference in measured and expected power and the lower calorific value of the fuel used by the vessel. This method for estimating fuel consumption doesn’t require data from the vessel on specific fuel oil consumption. Because this approach relies only on powering measured at propulsion, it calculates fuel savings or penalties due to hull condition only, excluding any hotel load. Greenhouse gas emissions saved are then calculated as 3.2 metric tons CO2 per metric ton fuel oil burned (Olmer 2017).
Cleaning Impact
Vessel 1 was fouled significantly past the level that EverClean robots are designed for at the time of its only cleaning. The vessel’s vertical sides had accumulated encrusting bryozoans (FR40) and heavy coverage of filamentous green algae (FR30). The flat bottom had accumulated tube worms (FR40) and a coverage of heavy slime (FR20). The robots deployed were able to remove a majority of the green algae and all of the slime present but did not remove the calcareous tube worms and bryozoans.
Vessel 1’s powering performance improved significantly after cleaning. Power measurements collected 90 days after cleaning dropped from measurements collected during the 90 days before service by 2.5% on average. Vessel 1’s powering required to maintain its operations was reduced by an average of 2.0MW, for a cumulative savings of roughly 80 metric tons of fuel in 90 days after service. Given a value of 3.2 metric tons of CO2 per tonne of fuel burned, this equates to reduced emissions of 256 metric tons of greenhouse gasses.

At the start of service, Vessel 2 was in significantly better shape than Vessel 1, with coverage of mostly microfouling and closer to the design rating of the EverClean system. Vessel 2’s forward sides had accumulated very light slime and incipient green algae (FR10). Aft sides had grown heavy green algae (FR 30), and the flat bottom was covered with heavy slime (FR20).
Vessel 2 was proactively cleaned over 7 months over 19 port calls. Light slime on the vessel’s forward sides was cleaned during the first visit, and the forward sides could be maintained at FR0 for the remainder of service.
Macrofouling coverage on the aft sides was gradually reduced to mostly clean after several rounds, so EverClean robots removed slimes that settled between cleanings. The vessel’s flat bottom was found to have a coverage of tenacious biofilm. Tenacious biofilms have been noted in published long-term proactive cleaning studies (Hearin 2015) as being tough, thin biofilms made up of species of diatoms that have higher adhesion strengths and are resistant to hydrodynamic stresses (Hunsucker 2018). Similar to the macrofouling on the vessel aft sides, these biofilms took several rounds of cleaning to be reduced to slime settling during proactive service.
Vessel 2’s powering performance steadily improved, attributable to the EverClean service enhancing its hull condition. Powering performance had improved by 9% after 4 months at August service, 12% after 6 months at October service, and nearly 20% after 7 months at November service. Powering at propulsion had improved by roughly 1.9MW for a cumulative savings of 320 metric tons of fuel over 7 months of proactive service and 1,024 metric tons reduction in CO2 emissions.

Conclusion
In conclusion, the EverClean program by Greensea IQ presents a revolutionary solution to hull fouling in the maritime industry, contributing significantly to fuel savings and environmental preservation. By addressing the fundamental problem of hull deterioration through proactive cleaning, this service has showcased remarkable outcomes for vessels such as those discussed in this paper.
The data presented demonstrates the tangible impact of the EverClean service on fuel efficiency and greenhouse gas emissions. Vessel 1, despite being significantly fouled before cleaning, experienced a notable reduction in fuel consumption and powering requirements, resulting in savings of approximately 80 metric tons of fuel and 256 metric tons of CO2 emissions within just 90 days post-service. Meanwhile, Vessel 2, benefiting from proactive cleaning over seven months, saw even more significant improvements, with fuel savings of 320 metric tons and a substantial reduction of 1,024 metric tons in CO2 emissions.
Moreover, the EverClean program not only delivers on its promise of fuel efficiency but also ensures the preservation of hull integrity without causing damage or wear. Through meticulous robotic cleaning tailored to specific fouling conditions and coating types, EverClean maintains vessels in an optimal state, prolonging their operational lifespan and reducing maintenance costs.
References
“Analysing the impact of marine biofouling on the energy efficiency of ships and the GHG abatement potential of biofouling management measures” 2022. International Maritime Organization, Glofouling partnerships.
Hearin J, Hunsucker K, Swain G, Stephens A, Gardner H, Lieberman K, Harmer M. 2015. “Analysis of long term mechanical grooming on large scale test panels coated with an antifouling and a fouling release coating.” Biofouling
Hunsucker K, Vora G, Hunsucker T, Gardner H, Leary D, Kim S, Lin B, Swain G. 2018. “Biofilm community structure and associated drag penalties of a groomed fouling release ship hull coating.” Biofouling
“ISO 19030-2 Measurement of changes in hull and propeller performance — Part 2: Default method.” 2016. International Organization for Standardization.
Kinnaman B. 2019. “The Future: Autonomous Robotic Hull Grooming.” MarineLink
“Maximizing fuel efficiency – Hempel SHAPE.” 2018. Hempel. hempel.com/news
“New ISO 19030 can contribute to reducing fleet energy costs.” 2017. Jotun. Jotun.com/us-en/industries/news-and-stories
Olmer B, Comer B, Roy B, Mao X, Rutherford D. 2017. “Greenhouse gas emissions from global shipping, 2013-2015.” International Council on Clean Transportation.
Download
Click to download a PDF of the white paper.

